
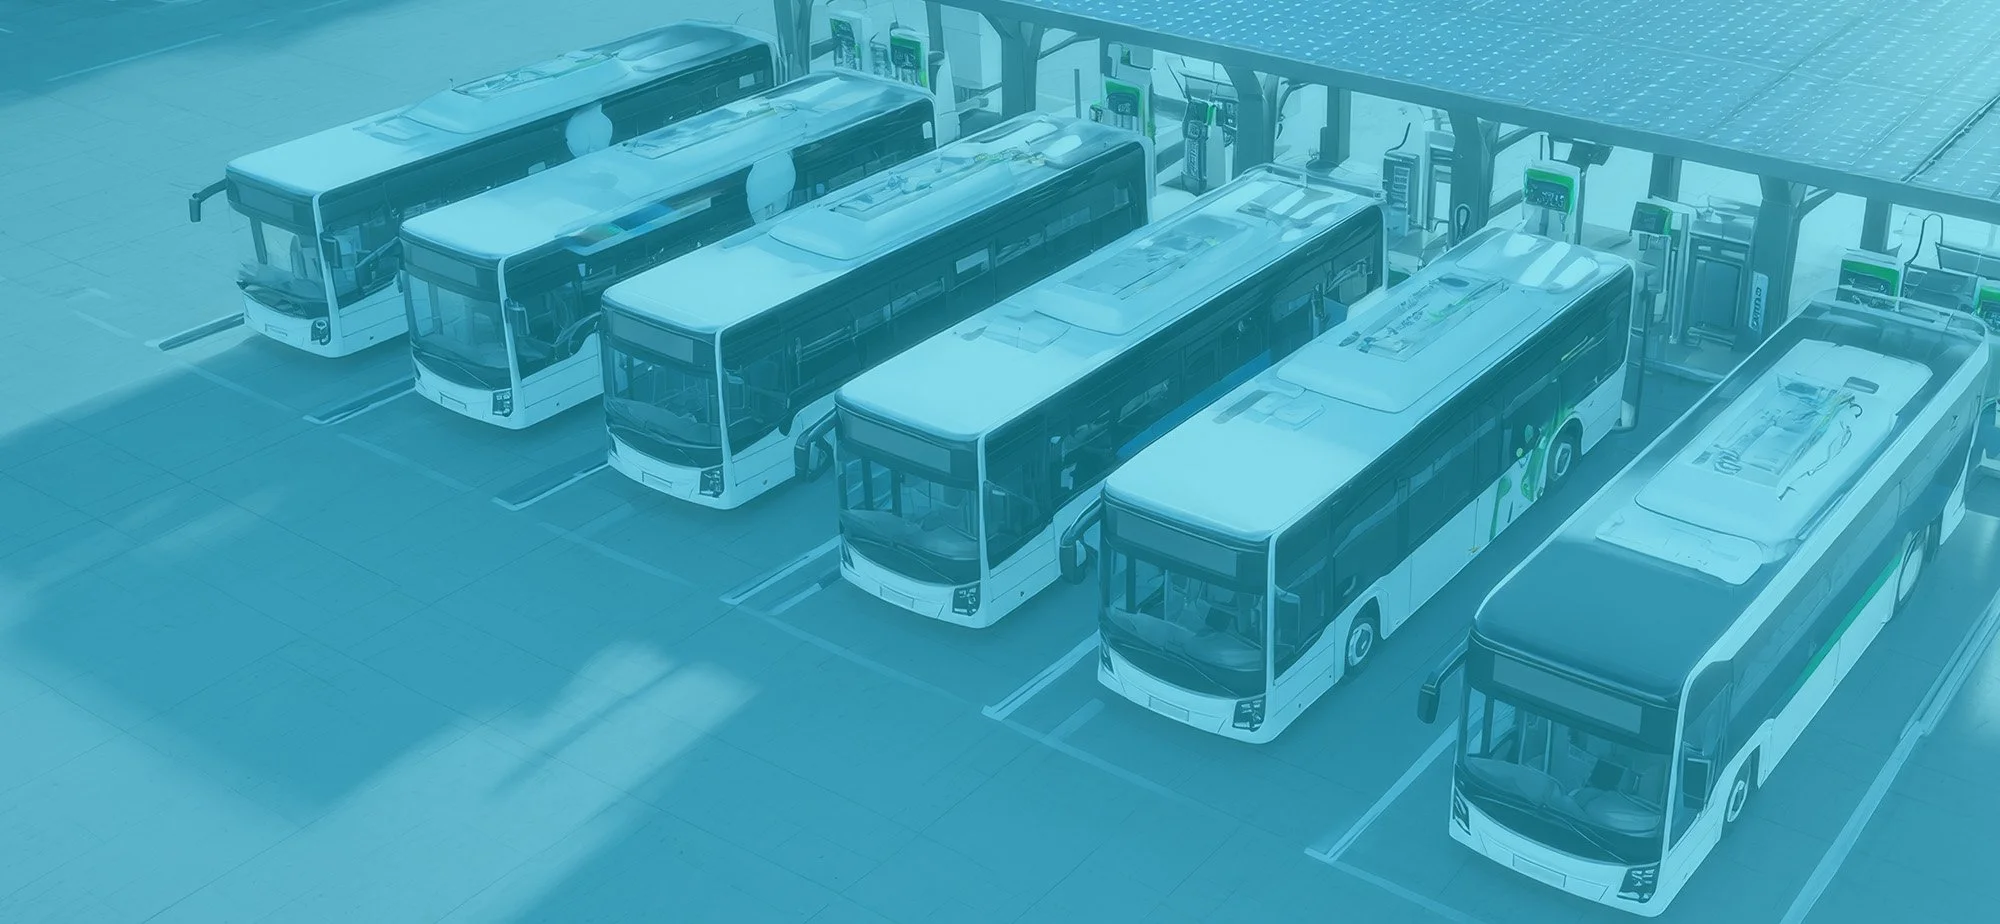
transition planning
design fleets and depots that work in the real world
Transition Planning turns your data and constraints into an operating blueprint for future concessions and fleet transitions. We design how vehicles, depots, charging or fueling, and schedules will work together so you can scale electrification and mixed fleets without surprises.
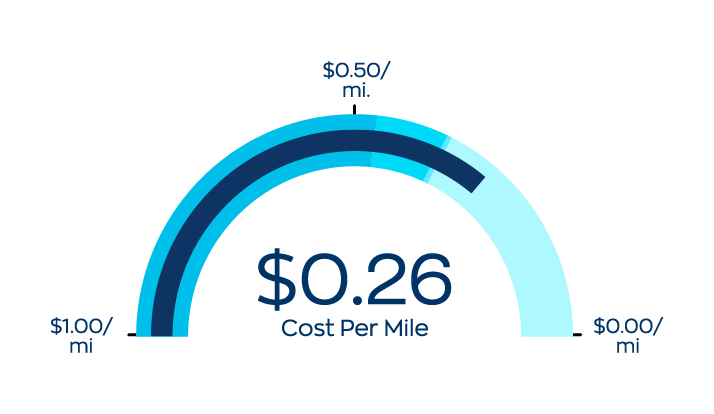
The result is a practical plan that meets service, protects reliability,
and keeps cost under control.

why Transition Planning

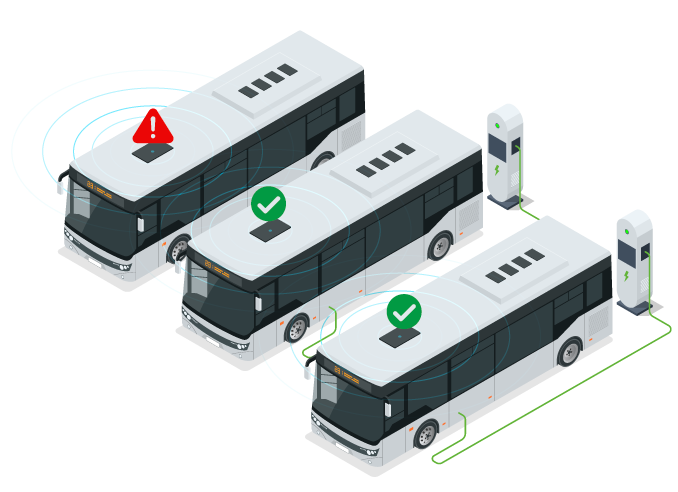
De-risk fleet transitions
Test proposed fleet mixes, work rules, and depot plans before you commit capital.
Avoid over building
Size vehicles, chargers, and bays to what you actually need instead of relying on blanket safety margins.
Keep service reliable
Stress test designs under peaks, weather, incidents, and availability shocks.
key capabilities
Depot and yard configuration
Diagnose current bottlenecks in staging, queuing, pull in and pull out, relief points, and bay use. Design layouts, flows, and charger or fuel bay placement that raise throughput without unnecessary infrastructure.
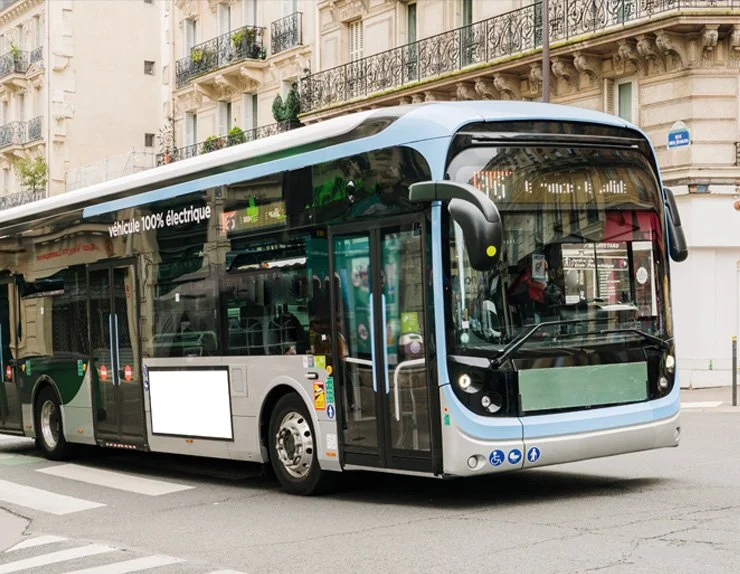
Fleet
composition
Right size vehicle types and counts across ICE, hybrid, CNG, and battery electric. Match vehicles to duty cycles, terrain, climate, and layover patterns so you can deliver the work with fewer assets and lower lifecycle cost.
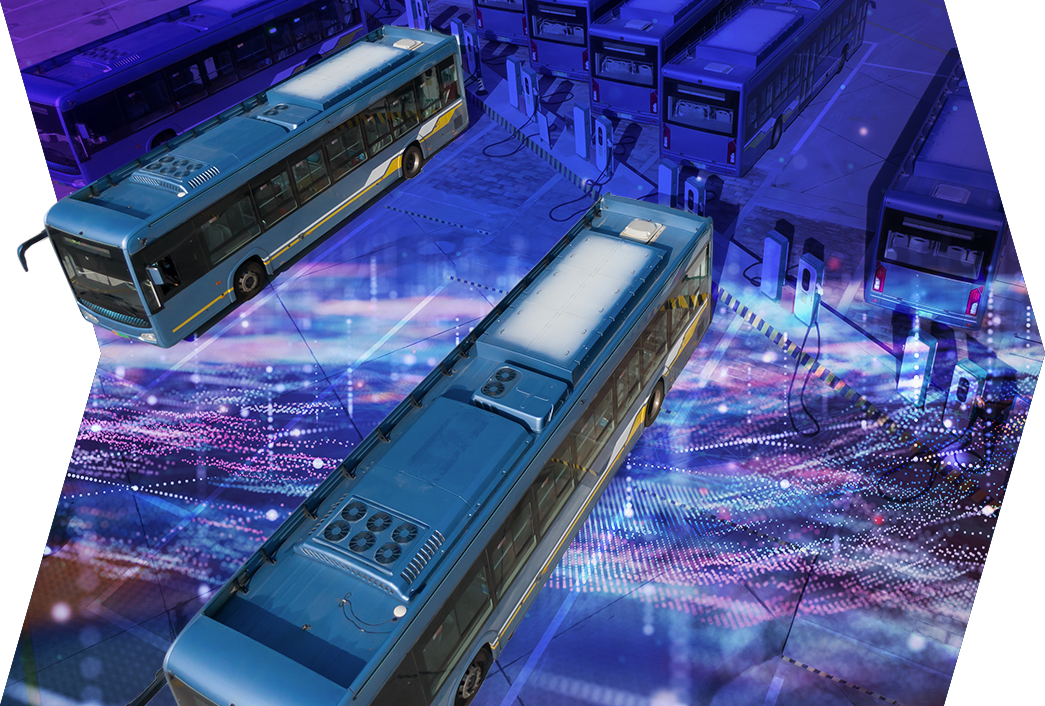
Charge and
fueling strategy
Coordinate charging or fueling windows with blocks and reliefs. For EVs, align power, dwell, and tariffs to shrink peak demand and charger count. For ICE and CNG, shift fueling to off peak while keeping operations smooth.
how Transition Planning runs
A 3 step outline
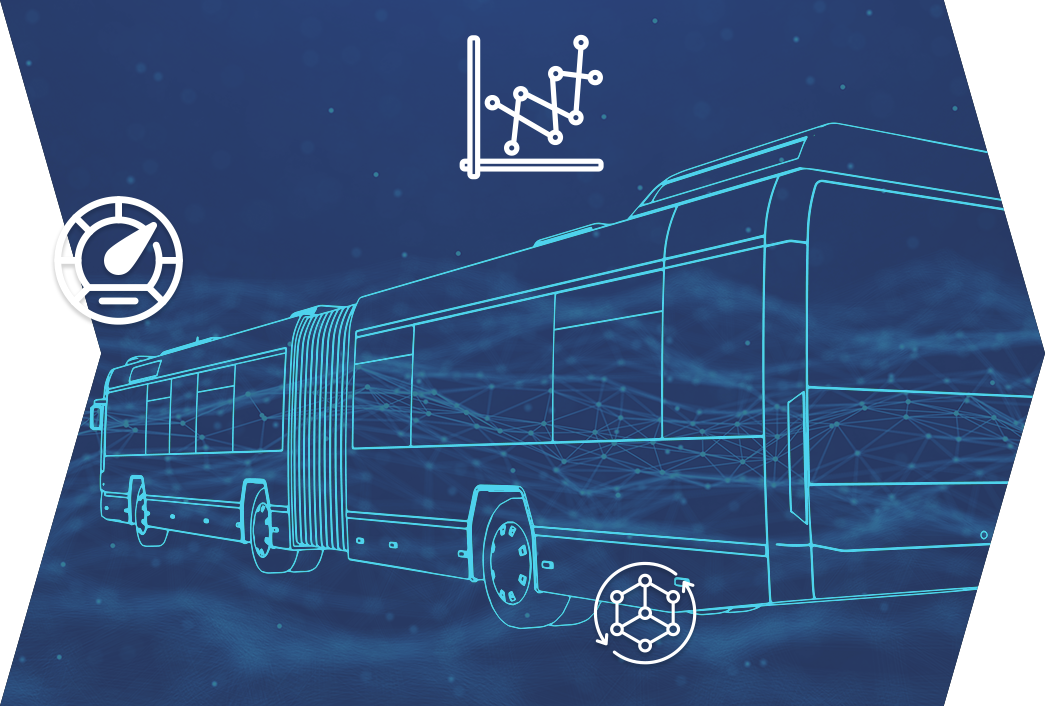
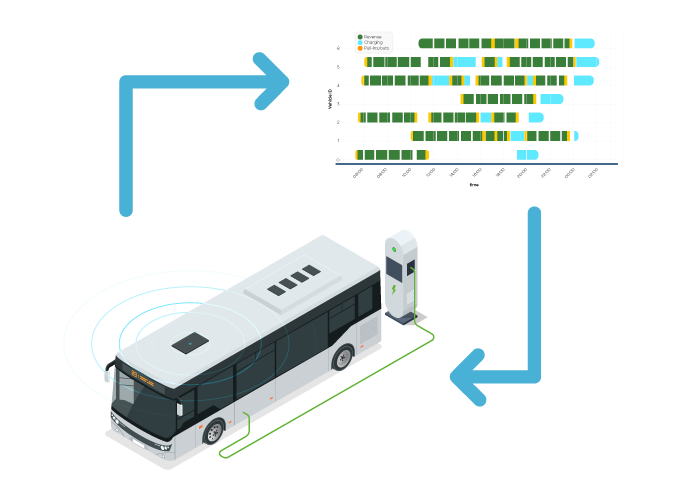
Model how you
operate today
Build a bottom up digital twin from routes, timetables, reliefs, dwell times, yard layouts, tariffs, and work rules.
Explore
scenarios
Use interconnected models to test fleet mixes, depot layouts, and energy strategies under realistic conditions.

Deliver
a blueprint
Provide a clear design
package with recommended fleet and depot configuration, charge or fuel strategy, and implementation phases.
how it links to
Spotlight and 360
Use Spotlight to understand current concessions, Transition Planning to design future ones, and 360
to keep them on track once live.
360
360 keeps everything connected day to day so each concession stays on track and your next bids are informed by real performance.

Spotlight
Spotlight gives you the first diagnostic and set of actions.

ready to get started?
Talk with us about an upcoming tender or transition and we will show how Transition Planning can de-risk it.