


360
continuous bid-to-operate analytics
fleetcast 360 is a subscription analytics service that keeps each concession operating to bid. It connects bid assumptions, live operations, and financial data into one set of dashboards and alerts so you see issues early, understand the causes, and act before margins slip.
360 is the always on layer that sits above your existing systems to monitor performance across mixed and eBus fleets.

why operators subscribe to 360

Continuous visibility
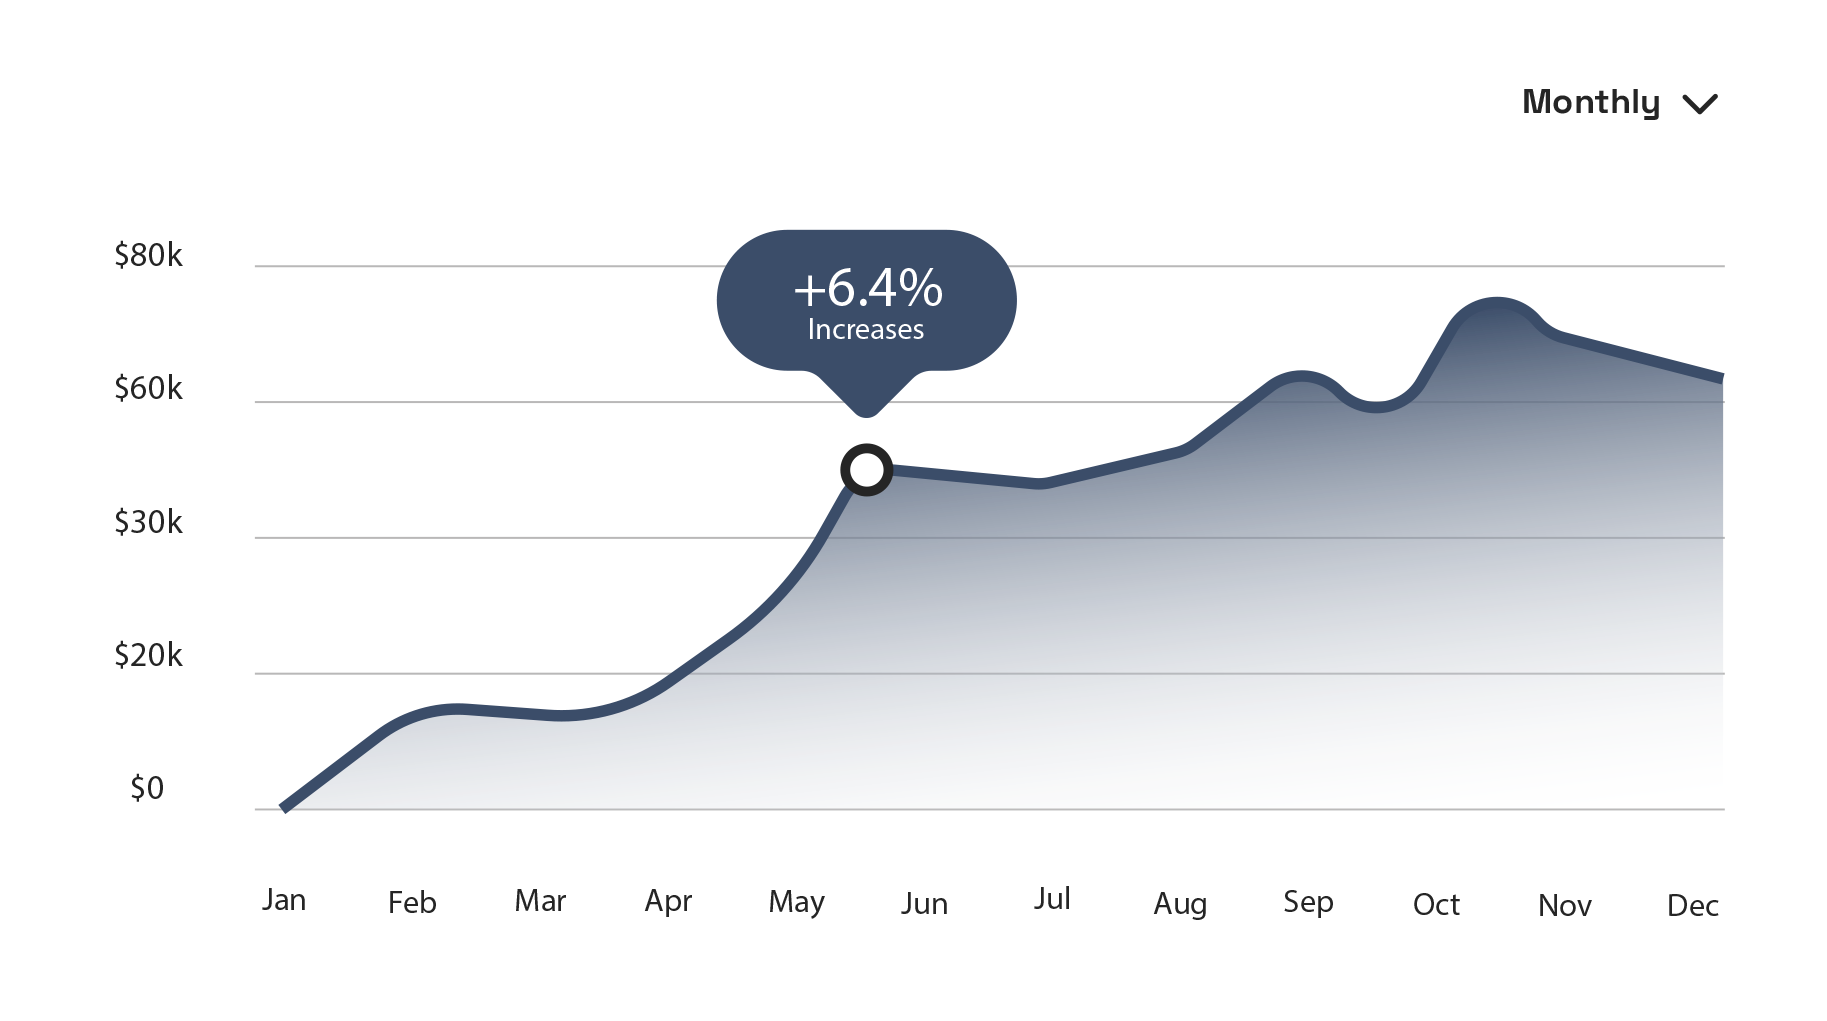
Track plan versus actual performance for cost, reliability, and service in one place.

Early warning
Get alerted when key KPIs drift so you can intervene before issues become structural.

Better next bids
Feed real performance data back into assumptions for future tenders and renewals.
what you get with 360
Executive and operations dashboards

Live views of concession performance with simple bridges from bid assumptions to actual results.
Automated variance detection

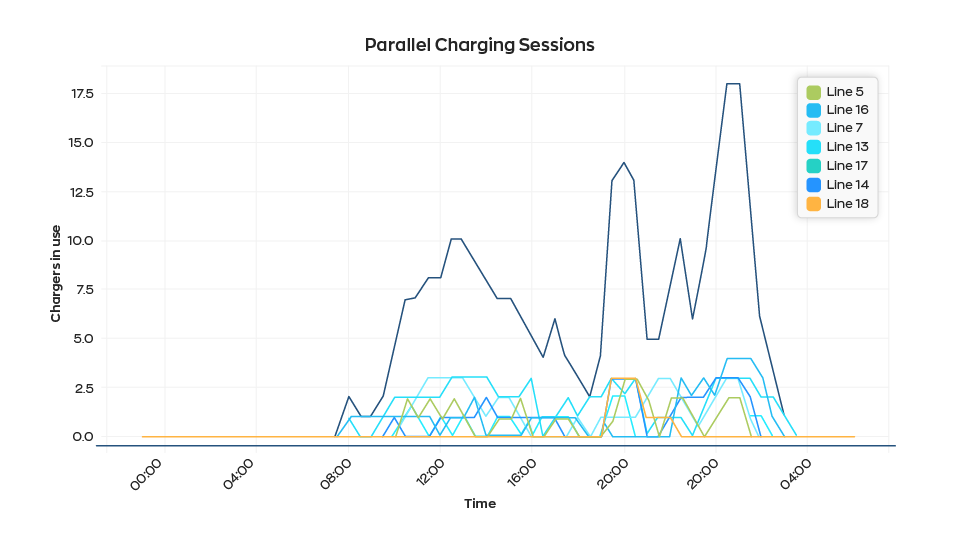
Monitoring that flags abnormal patterns in labor, fleet use, energy or fuel cost, missed trips, and schedule adherence.
Root cause insights

Breakdowns by route, depot, time of day, vehicle type, and driver or block so teams know where to act.
Decision support for bids and redesigns

Scenario views that let you test schedule tweaks, charging plans, and operational changes against historic performance.
how 360 works in practice

Connect data from bid, operations, and finance

Monitor variance
and alerts

Review insights and update actions and assumptions
how 360 fits with Spotlight and Transition Planning
360 keeps everything connected day to day so each concession stays on track and your next bids are informed by real performance.

Spotlight
Spotlight gives you the first diagnostic and set of actions.

Transition Planning
Transition Planning designs how your future fleet and depots should run.

ready to get started?
Ready to turn your concessions into an always on operating to bid control system?