

spotlight
find where your concession is drifting
Spotlight is a 6 week operational diagnostic for public transport concessions. It connects bid assumptions with live operations data so you can see where costs and reliability are drifting and what to do about it.
For PTOs running diesel, eBus, or mixed fleets, Spotlight builds a clear, defensible baseline for performance and cost, then highlights the fastest levers to bring operations back in line with the bid.

why operators use Spotlight

See the variance
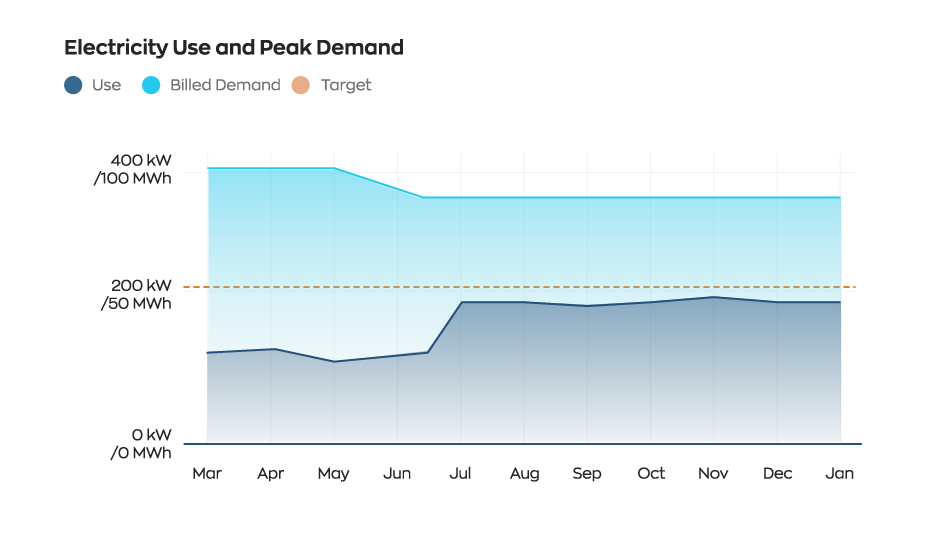
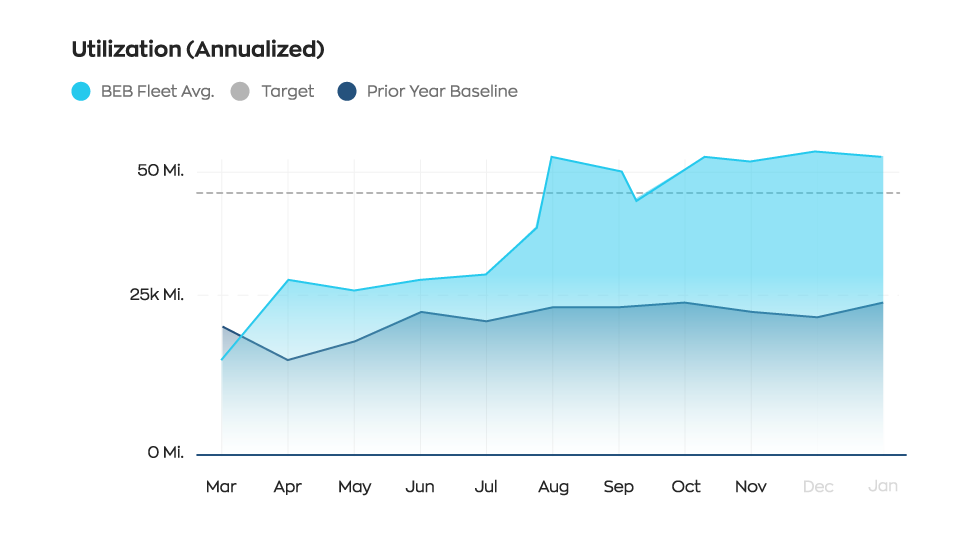
Quantify where plan versus actual is breaking down across cost, service, and reliability.
Find the levers
Identify the drivers behind variance such as swaps, missed trips, energy use, overtime, yard delays, and availability.

Act with confidence
Get a short list of prioritized actions with expected impact on cost and performance.
what is included in Spotlight
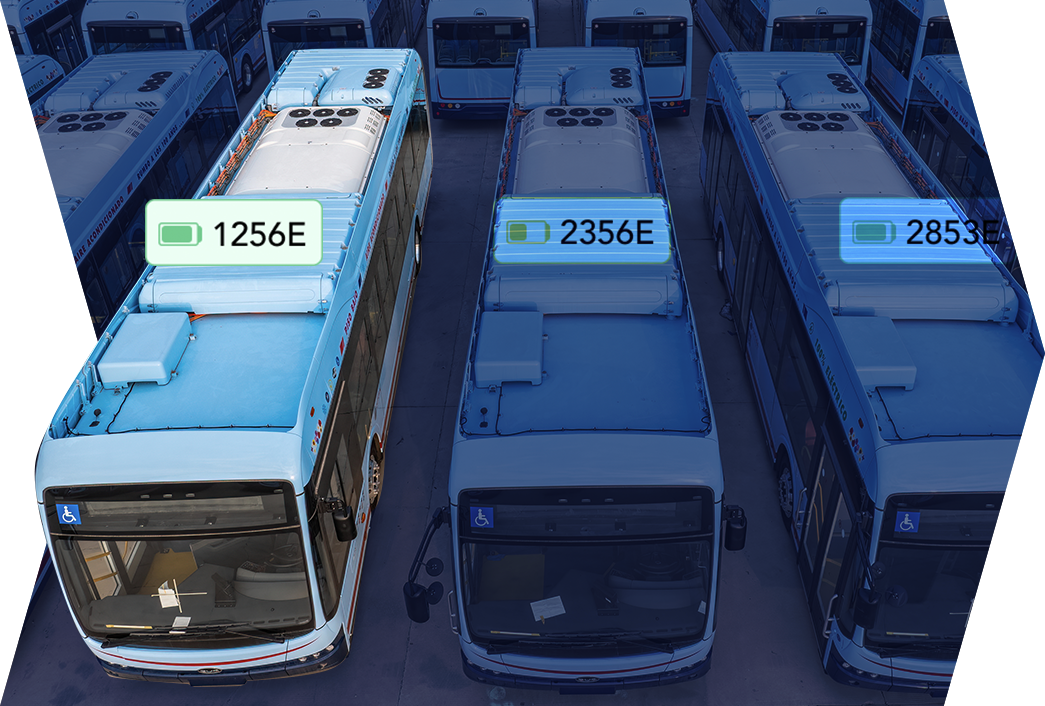
Concession data model
Unify bid, operations, maintenance, HR, and finance data into one view.
Root cause insights

Analytics that trace issues like missed trips or high energy cost back to concrete operational causes.
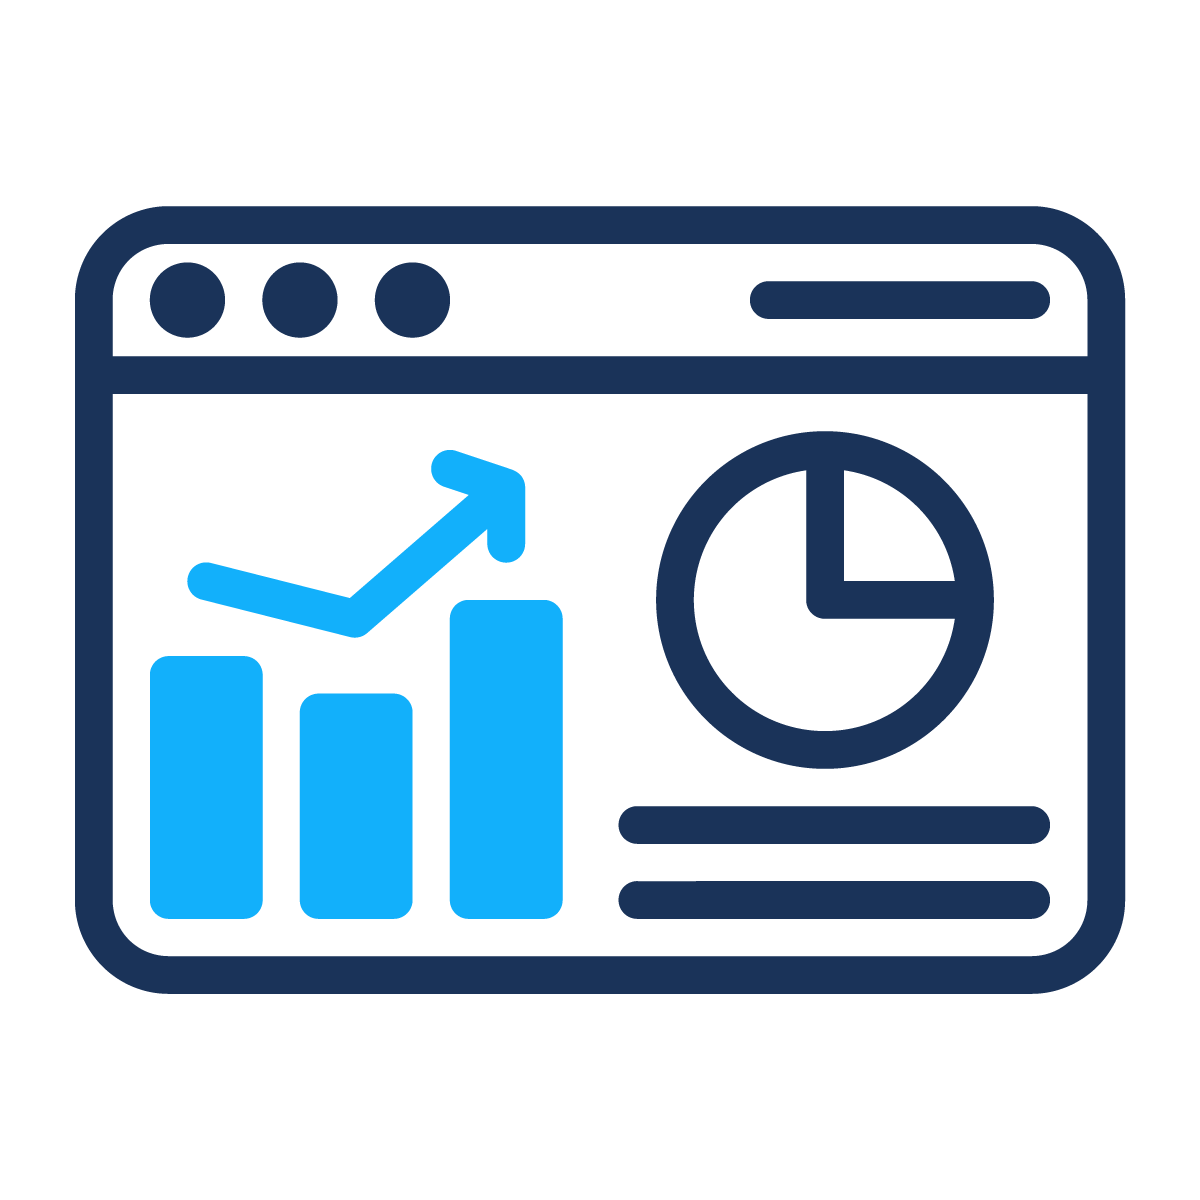
KPI baseline and dashboard

Baseline metrics for utilization, energy or fuel intensity, service reliability, missed trips, and cost per service hour, accessible in simple dashboards.
Action plan
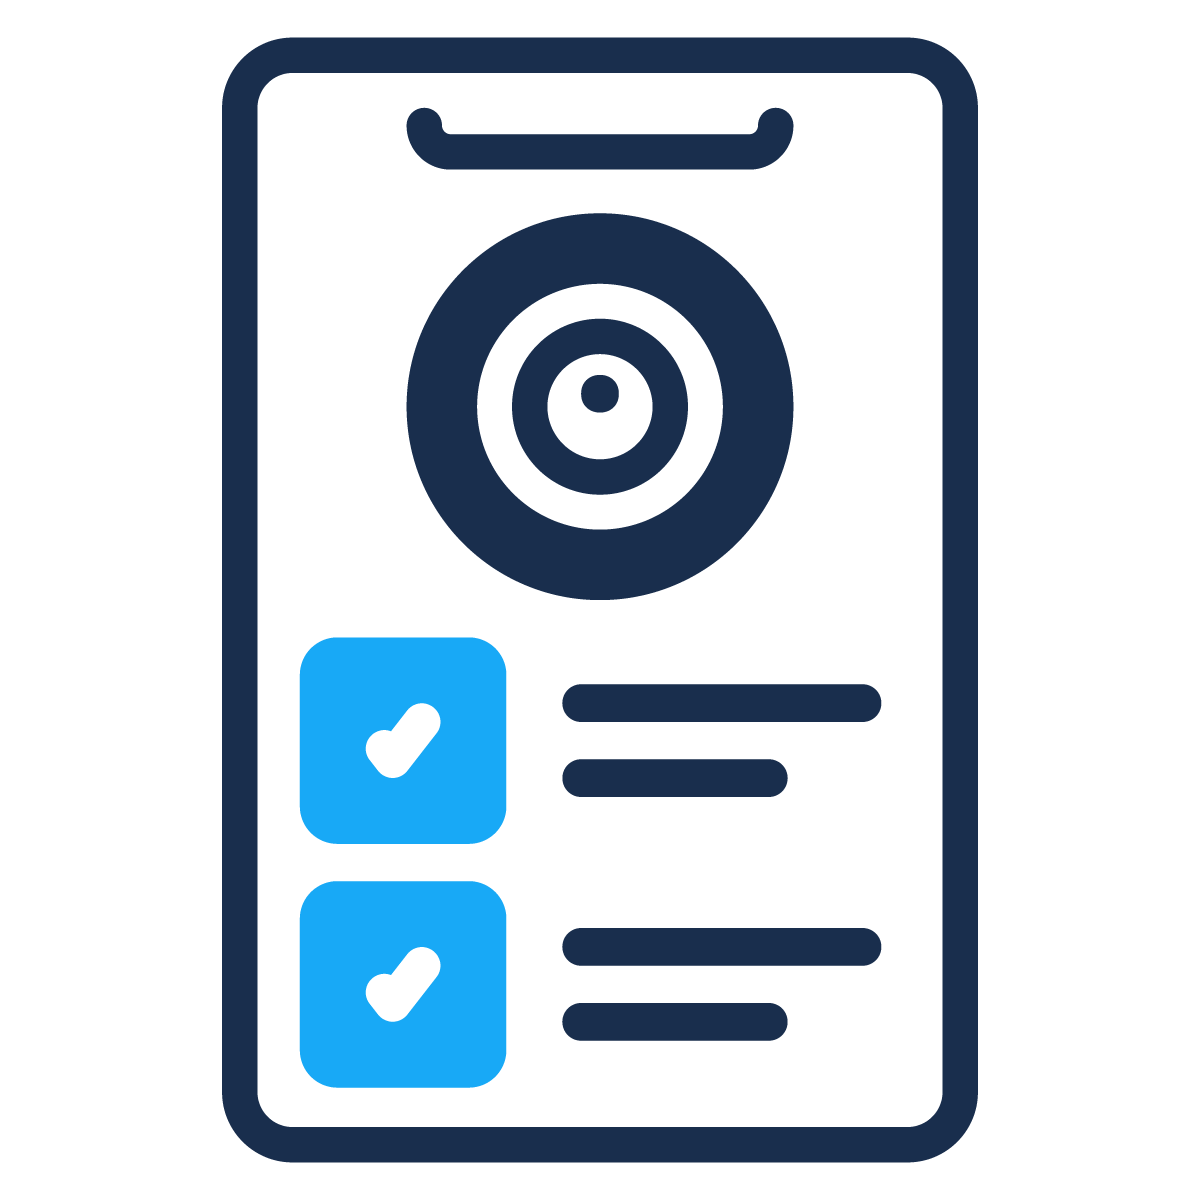
A concise report and roadmap that separates quick wins, 90 day initiatives, and longer term improvements.
how Spotlight runs
How Spotlight runs in 6 weeks
Discover and connect
Align on goals, select one concession, and connect the key data sources so the model reflects how you actually run.

Analyze and diagnose
Run AI assisted analysis and simulations to map plan versus actual, rank KPIs, and expose root causes of variance.

Deliver and hand off
Review findings with your team, agree on actions, and leave you with dashboards and documentation you can keep using.
how Spotlight fits with the other solutions
Start with Spotlight for the first diagnostic, use Transition Planning for upcoming transitions, and 360 for continuous tracking.

360
360 keeps everything connected day to day so each concession stays on track and your next bids are informed by real performance.

Transition Planning
Transition Planning designs how your future fleet and depots should run.

ready to get started?
Ready to turn your concessions into an always on operating to bid control system?