
The future of your electrification journey, powered by AI
Designing and managing efficient fleet operations is hard - especially when vehicle availability, depot capacity, and daily demand fluctuate. Whether you run ICE, hybrid, CNG, battery-electric, or a mix, traditional planning often creates bottlenecks, underutilized assets, and unnecessary cost.
Blueprints for Smarter Fleet Operations
fleetcast’s Operational Design service turns your data and constraints into a practical operating blueprint - maximizing capacity, protecting reliability, and minimizing cost across ICE and EV fleets.
From facility layout to charge/fuel strategy, we design with real-world precision so your operation runs smoothly today and scales confidently tomorrow.
Key features
Bottom-up modeling

We start from how your system actually runs - routes, timetables, reliefs, dwell, tariffs/fuel prices, and yard constraints—not idealized specs.
Advanced scenario simulation

Interconnected models are stress-tested under realistic conditions (peaks, weather, incidents, work rules, depot limits) to expose bottlenecks and quantify tradeoffs.
Fully customized

We build a high-fidelity operational digital twin tuned to your assets, geography, and rules, enabling accurate “what-if” comparisons.
Powered by AI

Cloud-scale optimization explores thousands of feasible designs to find robust solutions—balancing cost, reliability, energy/fuel use, and service quality.
Meet the Team
-
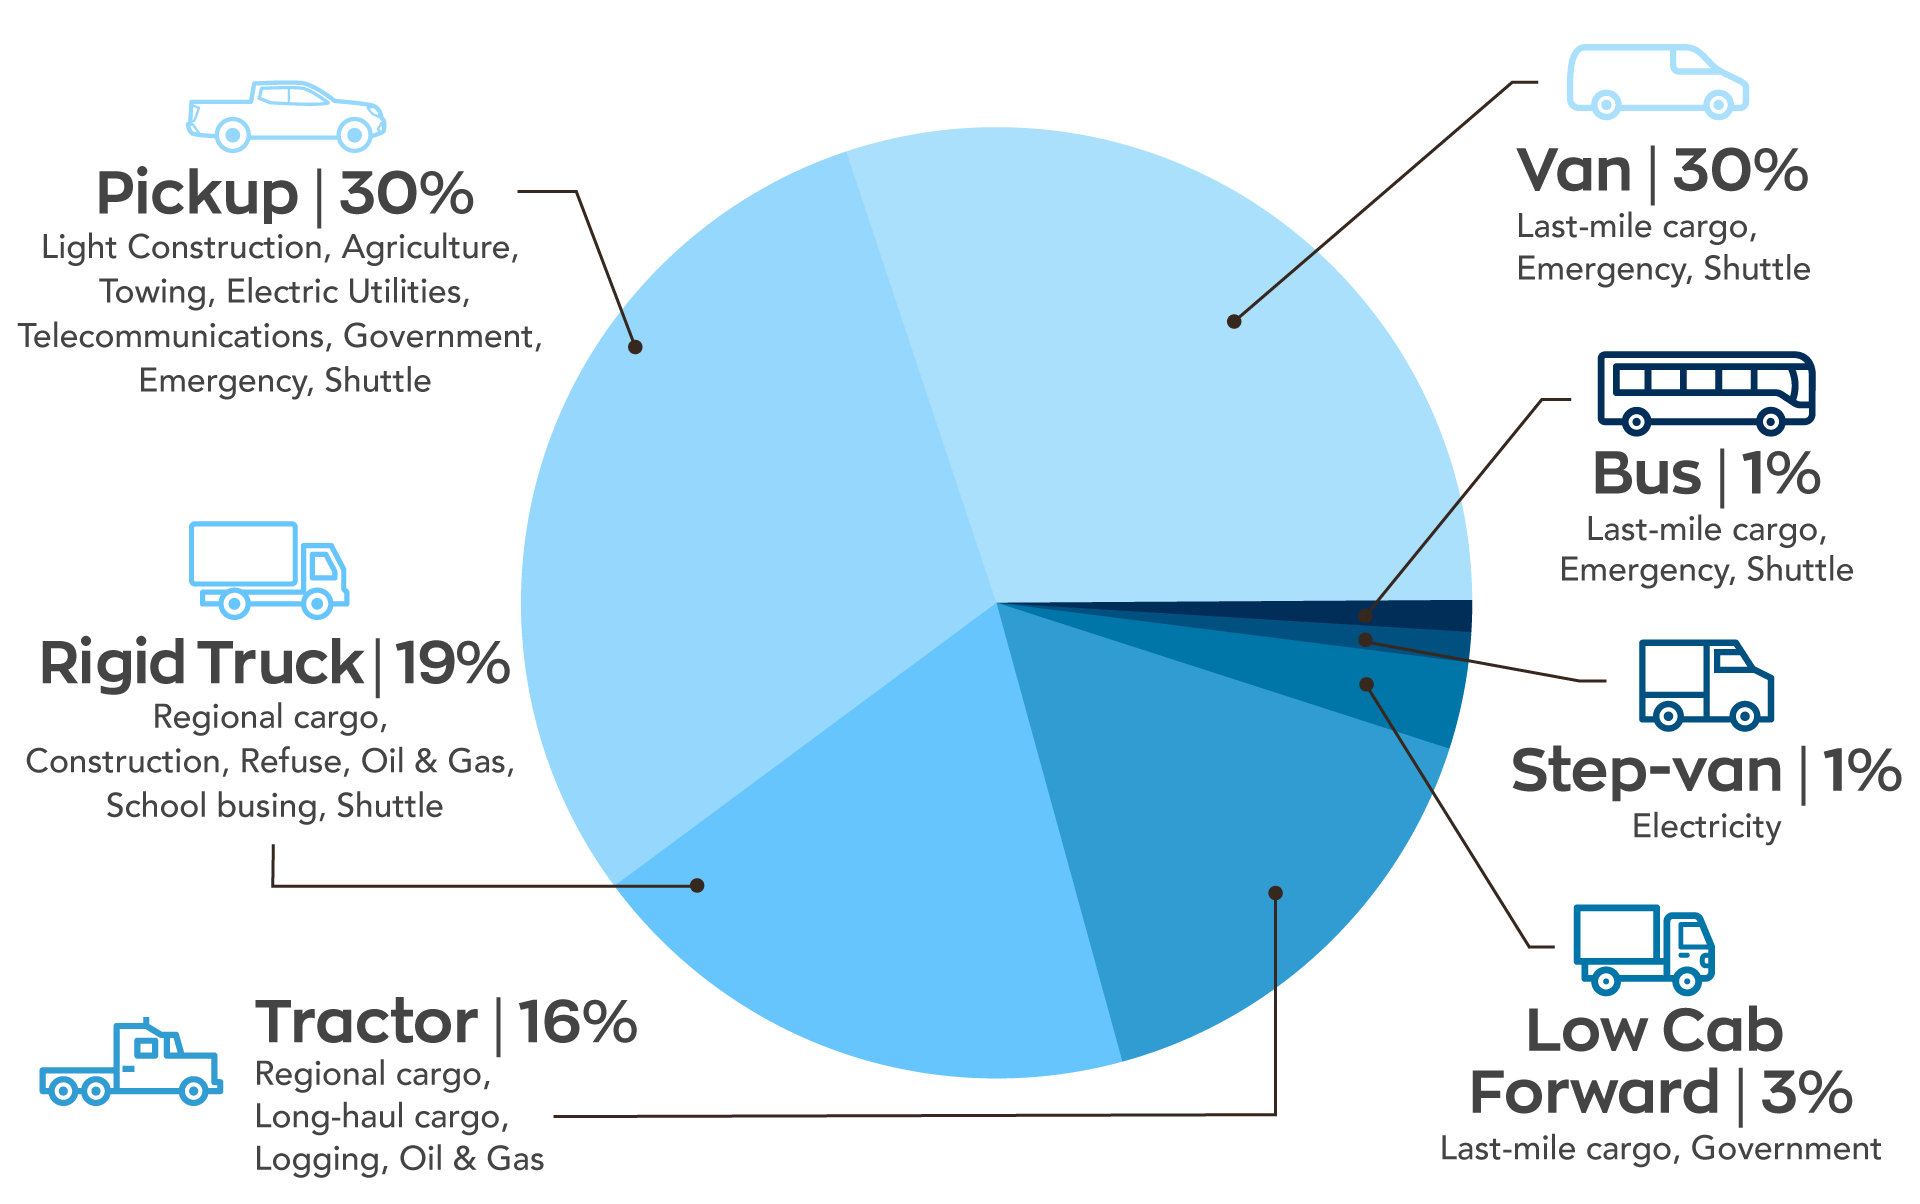
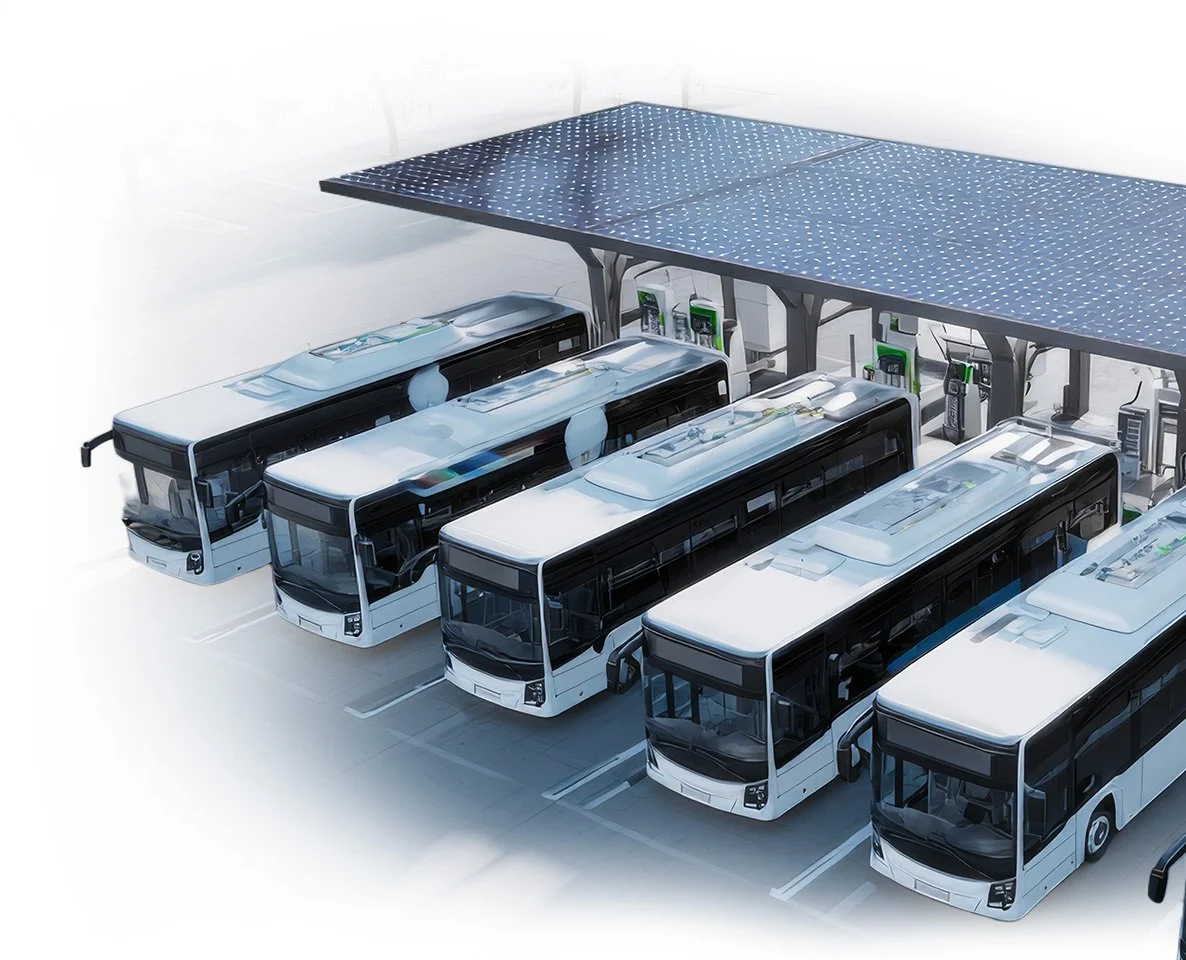
Fleet composition
Reduce capital and operating cost with the right mix
Right-size vehicle types and counts (ICE, hybrid, CNG, BEB) to the jobs to be done. Optimize configurations for duty cycles, terrain, climate, and layover realities—so you meet service with fewer assets and lower lifecycle cost.
-

Facility configuration
Maximize throughput while minimizing infrastructure spend
Diagnose the true causes of yard and depot delays—staging, queuing, pull-in/out, relief points, and bay utilization. Design improved layouts, charger/fuel-bay placement, and traffic flow to raise throughput and reduce dwell without over-building.
-

Charge delivery
Cut hardware and utility costs with smarter energy & fueling design
Coordinate fueling/charging windows with blocks and reliefs. For EVs, align charge power, dwell, and TOU tariffs to shrink peak demand and charger counts. For ICE/CNG, right-size fueling capacity and shift demand to off-peak. Same service, lower capex/opex.

Get started with fleetcast design
Ask the team how AI-powered operational design can improve today’s performance and de-risk tomorrow’s plan across mixed and eBus fleets.