

Operational Assessment: build data-driven baselines to make the right decisions across ICE, hybrid, CNG, and battery-electric fleets.
Transform your fleet operations with clear, defensible insights tailored to your network, assets, and constraints.
Operating a modern fleet is complex - whether you’re running diesel today, piloting eBuses, or managing a mix of both. fleetcast’s Operational Assessment turns real operations data into evidence-backed findings that lower cost, improve reliability, and de-risk future plans.
Why choose fleetcast’s Operational Assessment?
Deep Analysis
Uncover inefficiencies, quantify opportunities, and establish a transparent performance baseline.

Actionable Insights
See the true drivers of cost and reliability across ICE, EV, and mixed fleets - energy/fuel intensity, dwell and deadhead, maintenance drivers, schedule adherence, and more.

Translate findings into practical recommendations for right-sizing fleet mix, improving schedules and yard flow, and preparing for phased transitions.

Strategic Planning
What’s included in an Operational Assessment?

Comprehensive data analysis
Harness advanced analytics to assess historical performance, identify bottlenecks, and surface high-ROI improvements.
Establish robust KPIs for utilization, energy/fuel efficiency, service reliability, uptime, and cost per service hour.
Leverage an operational digital twin to test scenarios and deliver targeted recommendations that boost efficiency.
Insights into EV operations
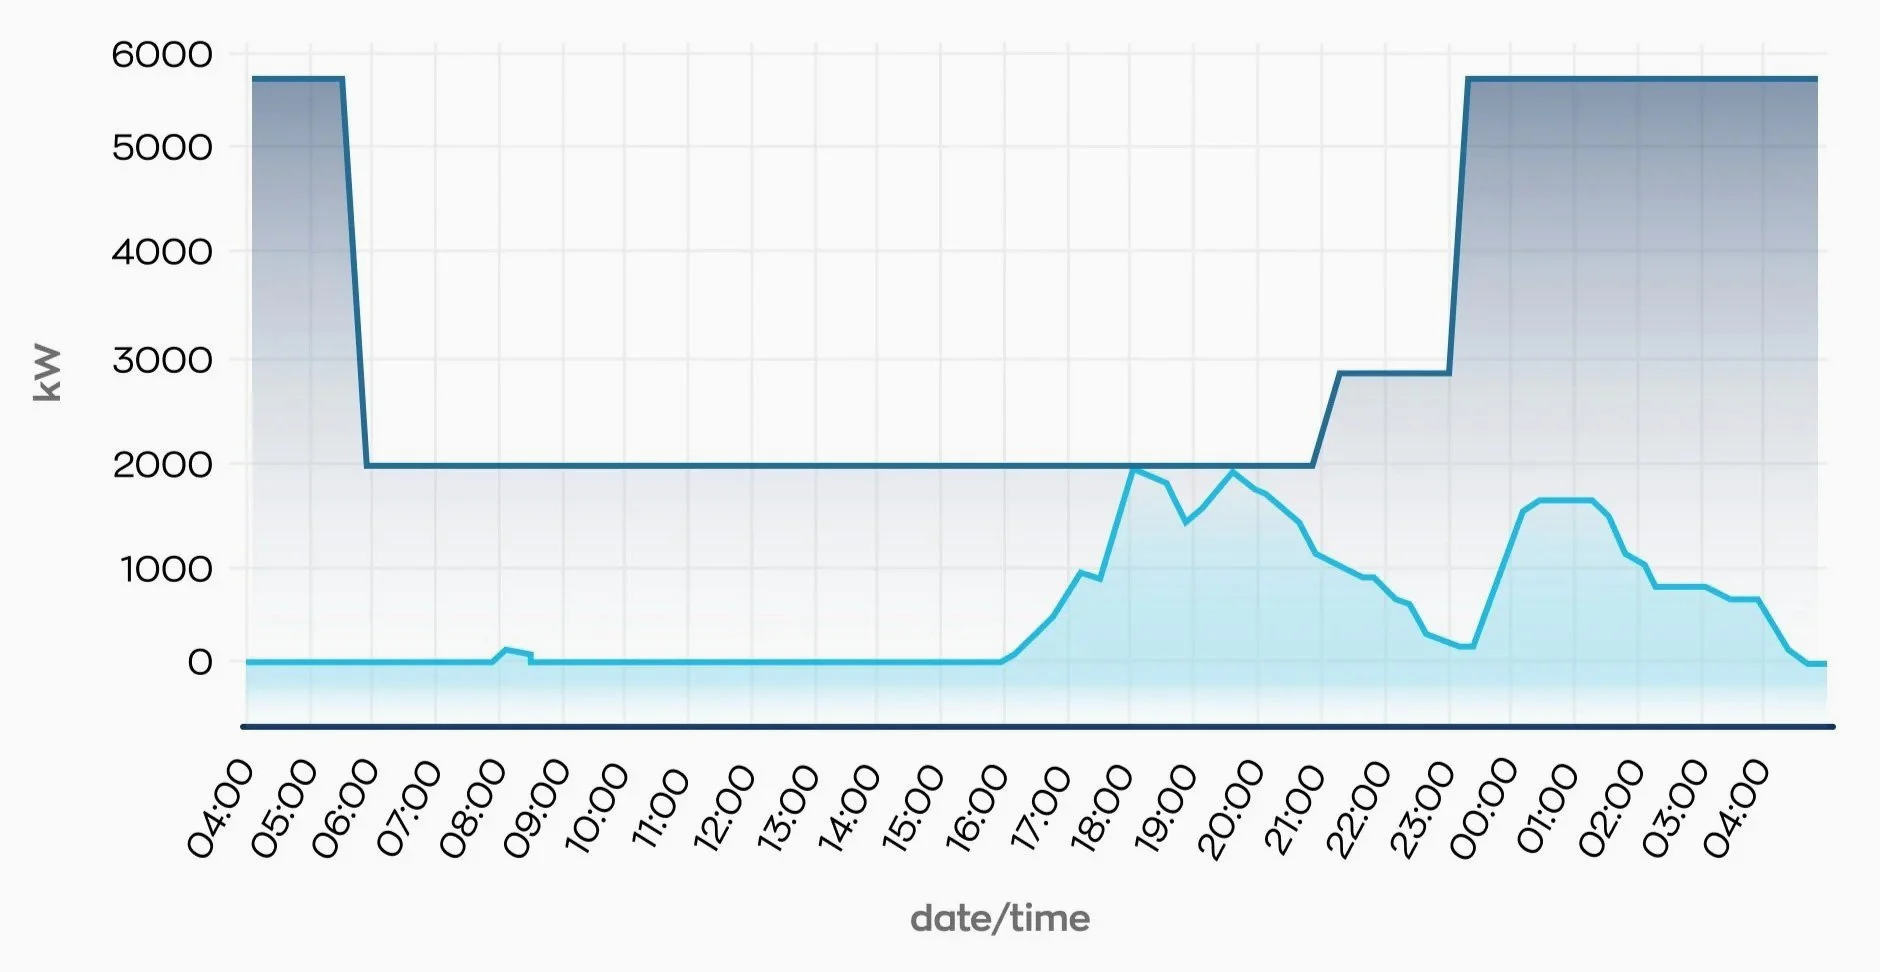
Gain a clear view of energy use and fueling/charging behavior across the whole fleet, with EV-specific performance under weather, terrain, and demand variability.
Assess depot/yard readiness—including charging capacity, queuing, staging, and pull-in/out—to align infrastructure with real operations.
Generate actionable insights to enhance resilience, reduce energy consumption, and maintain service quality as EV share grows.

Tailored recommendations
A concise assessment report with executive summary and evidence-backed recommendations.
KPI baseline dashboard and route/garage-level findings.
Scenario results from the operational digital twin with clear “if/then” actions.
A prioritized improvement roadmap (quick wins, 90-day actions, and longer-term items).
How it Works

Discovery and Data Collection
Collaborate to gather operations data, assets, facilities, tariffs/fuel prices, and work rules so the model reflects how your system actually runs.

Detailed Assessment
AI-assisted models and simulations reveal inefficiencies, quantify tradeoffs, and identify lean, reliable options under real constraints.
Report Delivery
Receive a clear, actionable package - findings, KPIs, scenarios, and a prioritized roadmap - aligned to your goals and timelines.

Discover how fleetcast can strengthen day-to-day operations and de-risk future plans with a tailored assessment.
Reduce Costs: Lower total cost of ownership by eliminating waste, right-sizing assets, and optimizing schedules, yard flow, and energy/fuel use.
Enhance Reliability: Improve schedule robustness, minimize downtime, and streamline depot operations.
Boost Efficiency: Increase vehicle and bay/charger utilization and improve pull-in/out, dwell, and layover planning.